![]()
The Techno-Economic Analysis (TEA) describes the design of the Eureka collection system, marking a step forward in refining our understanding of the economic and operational parameters for the selective collection of polymetallic nodules.
There are three reasons why this matters.
- Environmental Stewardship: At Impossible Metals, we prioritize harvesting critical minerals with low levels of impact on the seabed. The latest model further refines our design approach, ensuring we are not just economically viable but also true to our mission of preserving and protecting the marine environment.
- Scalability: By outlining potential fleet sizes and production rates, we aim to provide investors and stakeholders with a clear vision of expanding our operations, while offering flexible entry points for different market conditions.
- Transparency: We believe in openly sharing our methods and assumptions. The webinar and slideshow contain detailed breakdowns of costs, technologies, and economic indicators, enabling informed dialogue with partners, regulators, and the broader community.
What’s New in the Latest Version (v7)
- Revised approach for the collection of different sizes of nodules
Selective collection allows us to top-grade the resource, collecting the larger and thus more valuable nodules substantially very efficiently, also leaving a high proportion of nodules undisturbed. V7 of the model allows for the modelling of this impact. The nodule size distribution used was based on the data from the TMC NORI-D PFS. - Costs are based on quotes
In past models, there were some assumptions for the pricing of components based on best estimates. We are not basing all vehicle costs on vendor quotes, and in almost all cases, not yet considering volume pricing. - Updated the WACC
We have moved the WACC to be in line with the 8% used in the TMC NORI-D PFS. - Engineering Updates
Based on some design changes to the vehicles, the TEA model was updated accordingly.
Project 1 Profit & Loss
Project 1 P&L presents a high-level concept profit-and-loss model for a representative project, offering a clear view of economic performance under current assumptions. The scenario outlines projected revenues, direct and operating costs, and profitability margins across the life of the project, framed by our v7 modeling parameters. While structured in a typical P&L format, it’s tailored to the unique aspects of selective nodule harvesting and processing, helping to demonstrate the financial viability and key value drivers of our approach.
Access the spreadsheet here.
Techno-Economic Analysis
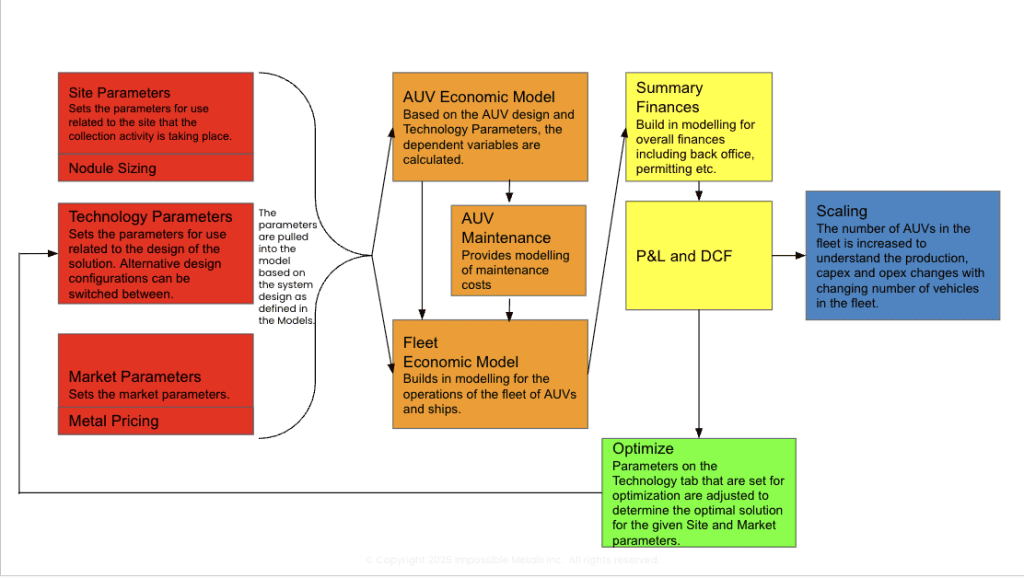
Model Introduction (Tabs)
Access the TEA here.
Next Steps for This Model
Further Validation: We are actively refining and validating the V7 model parameters through ongoing engineering efforts, analysis of test data, and incorporation of feedback from key stakeholders. This process ensures that our models remain robust, accurate, and aligned with real-world performance expectations.
Continuous Improvement: As we continue to gather new data from testing and validation activities, we will release further updates. These improvements will help us refine our fleet designs and integrate practical insights into future versions of the model, ensuring continual advancement and relevance.
Learn More
View the presentation.
Watch the webinar.
